MonitoringFS is a FUSE-based remote monitoring filesystem. It was formerly known as NagiosFS. Requests are done with UDP and the remote UDP server is extremely fast. A typical "cat" of one of the files in MonitoringFS takes about one millisecond.
MonitoringFS is contained in the ngtx-package. This package contains prebuilt Linux binaries (dynamically linked, x86_64) to offer simple and fast exploration of the tools.
More details: http://www.tuxad.de/monitoringfs.html
| "Client" side | "Server" side |
|---|---|
$ wget -q http://www.nagiosfs.de/ngtx.tgz $ tar xzf ngtx.tgz $ cd ngtx-20* $ mkdir mnt $ echo "localhost 127.0.0.1"|monitoringfs/monitoringfs -o direct_io mnt/ monitoringfs_hosts_count = 1, monitoringfs_keys_count = 22 $ ls -l mnt/ total 0 dr-xr-xr-x. 6 root root 0 2011-08-13 00:11 localhost $ ls -l mnt/localhost/ total 0 dr-xr-xr-x. 3 root root 0 2011-08-13 00:11 cat -r--r--r--. 1 root root 0 2011-08-13 00:11 cpui -r--r--r--. 1 root root 0 2011-08-13 00:11 cpuI -r--r--r--. 1 root root 0 2011-08-13 00:11 cpus -r--r--r--. 1 root root 0 2011-08-13 00:11 cpuu -r--r--r--. 1 root root 0 2011-08-13 00:11 cpuw -r--r--r--. 1 root root 0 2011-08-13 00:11 ctxtswitch dr-xr-xr-x. 3 root root 0 2011-08-13 00:11 diskusage -r--r--r--. 1 root root 0 2011-08-13 00:11 load1 -r--r--r--. 1 root root 0 2011-08-13 00:11 load15 -r--r--r--. 1 root root 0 2011-08-13 00:11 load5 dr-xr-xr-x. 4 root root 0 2011-08-13 00:11 loaduser -r--r--r--. 1 root root 0 2011-08-13 00:11 mailqsize -r--r--r--. 1 root root 0 2011-08-13 00:11 nettraf0 -r--r--r--. 1 root root 0 2011-08-13 00:11 nettraf1 -r--r--r--. 1 root root 0 2011-08-13 00:11 proccount -r--r--r--. 1 root root 0 2011-08-13 00:11 proccounttg -r--r--r--. 1 root root 0 2011-08-13 00:11 swaps dr-xr-xr-x. 2 root root 0 2011-08-13 00:11 timediff -r--r--r--. 1 root root 0 2011-08-13 00:11 uptime $ cat mnt/localhost/load1 0.03 $ cat mnt/localhost/cat/proc/loadavg 0.03 0.05 0.03 1/267 17702 $ cat mnt/localhost/cat/proc/sys/kernel/hostname fukato.localdomain $ |
$ wget -q http://www.nagiosfs.de/ngtx.tgz $ tar xzf ngtx.tgz $ cd ngtx-20* $ knoerre/knoerred 8888 127.0.0.1 |
$ tools/nagios-show-addresses </var/cache/nagios3/objects.cache|monitoringfs/monitoringfs -o direct_io /monitoringfs
monitoringfs_hosts_count = 2827, monitoringfs_keys_count = 5
$ ls -l /monitoringfs/|tail
dr-xr-xr-x 2 root root 0 Aug 13 09:10 vm56
dr-xr-xr-x 2 root root 0 Aug 13 09:10 vm57
dr-xr-xr-x 2 root root 0 Aug 13 09:10 vm58
dr-xr-xr-x 2 root root 0 Aug 13 09:10 vm59
dr-xr-xr-x 2 root root 0 Aug 13 09:10 vm60
dr-xr-xr-x 2 root root 0 Aug 13 09:10 vm61
dr-xr-xr-x 2 root root 0 Aug 13 09:10 vm63
dr-xr-xr-x 2 root root 0 Aug 13 09:10 vm64
dr-xr-xr-x 2 root root 0 Aug 13 09:10 vpn16101
dr-xr-xr-x 2 root root 0 Aug 13 09:10 vpn2005
$ { tools/nagios-show-addresses </var/cache/nagios3/objects.cache; cat ../service-checks3; } | monitoringfs/monitoringfs -o direct_io /monitoringfs
monitoringfs_hosts_count = 2812, monitoringfs_keys_count = 13
$ find /monitoringfs/w302/ \! -type d/monitoringfs/w302/cat/nagios-cache/allsmart
/monitoringfs/w302/cat/nagios-cache/fsckage
/monitoringfs/w302/cmdline/usr/lib/postfix/master
/monitoringfs/w302/diskinodes/home/www
/monitoringfs/w302/diskusage/home/www
/monitoringfs/w302/kernellog/06/var/log/messages
/monitoringfs/w302/load1
/monitoringfs/w302/loaduser/10000/2000000
/monitoringfs/w302/mailqsize/admiM
/monitoringfs/w302/proccount
/monitoringfs/w302/proccounttg
/monitoringfs/w302/process/syslog-ng
/monitoringfs/w302/swaps
$ cat /monitoringfs/w302/cat/nagios-cache/fsckage
146
$ cat /monitoringfs/w302/diskusage/home/www
30
$ cat /monitoringfs/w302/kernellog/06/var/log/messages
TIMEOUT
$ cat /monitoringfs/w302/mailqsize/admiM
TIMEOUT
$ cat /monitoringfs/w302/process/syslog-ng
1
$ cat /monitoringfs/mail01/mailqsize/admiM
2
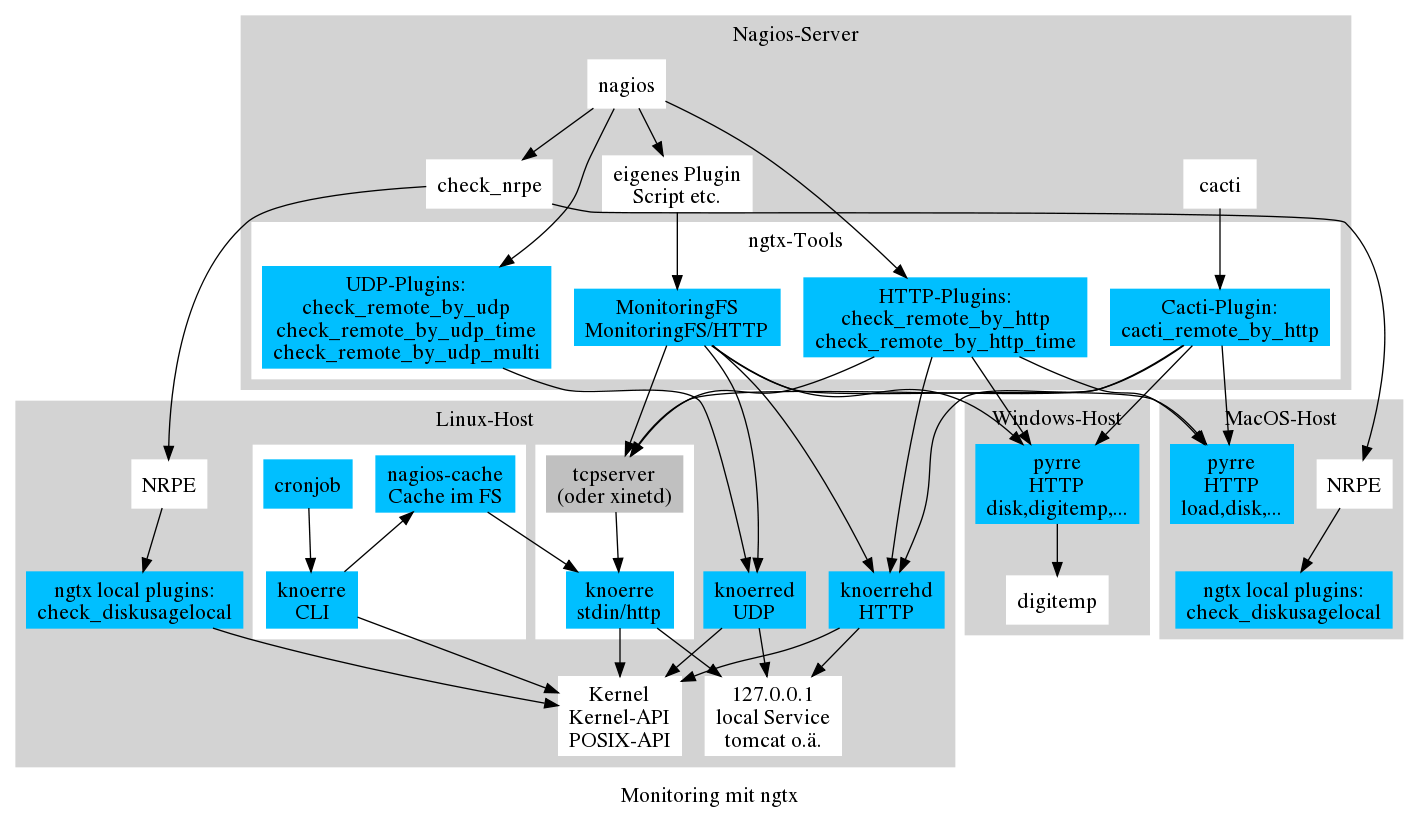
A diagram of ngtx and MonitoringFS usage shows this PNG-image.
Slides of OpenRheinRuhr 2011: www.tuxad.de/vortragsfolien.html